[Infographic] Content marketing metrics from engagement to conversion

Key takeaways
Last update: April 15, 2026
Your boss calls you into their (probably virtual) office. That’s scary. Then they say, “show me how your content is driving conversions.”
If the thought makes your stomach drop, you're not alone. In the Content Marketing Institute's 2026 B2B Content & Marketing insights report, 33% of respondents reported measuring content effectiveness among their top 3 content challenges that they can't shake. It’s hard to identify and track the kinds of content marketing metrics that indicate conversion. That’s because content marketing plays a much longer, more indirect role in influencing decisions, especially with the rise of LLMs and corresponding increase in off-domain engagement.
Content marketing builds trust, establishes brand authority, helps AI engines understand and recommend your brand, and nurtures buyer relationships over time. It influences the buyer across the entire journey—so you need metrics across the journey. Looking at your content performance from different angles can help you understand how well your content is achieving that.
So how do you measure it? How can you tell the story of your content performance to your boss?
15 content marketing metrics that will help you gauge how well your content is doing
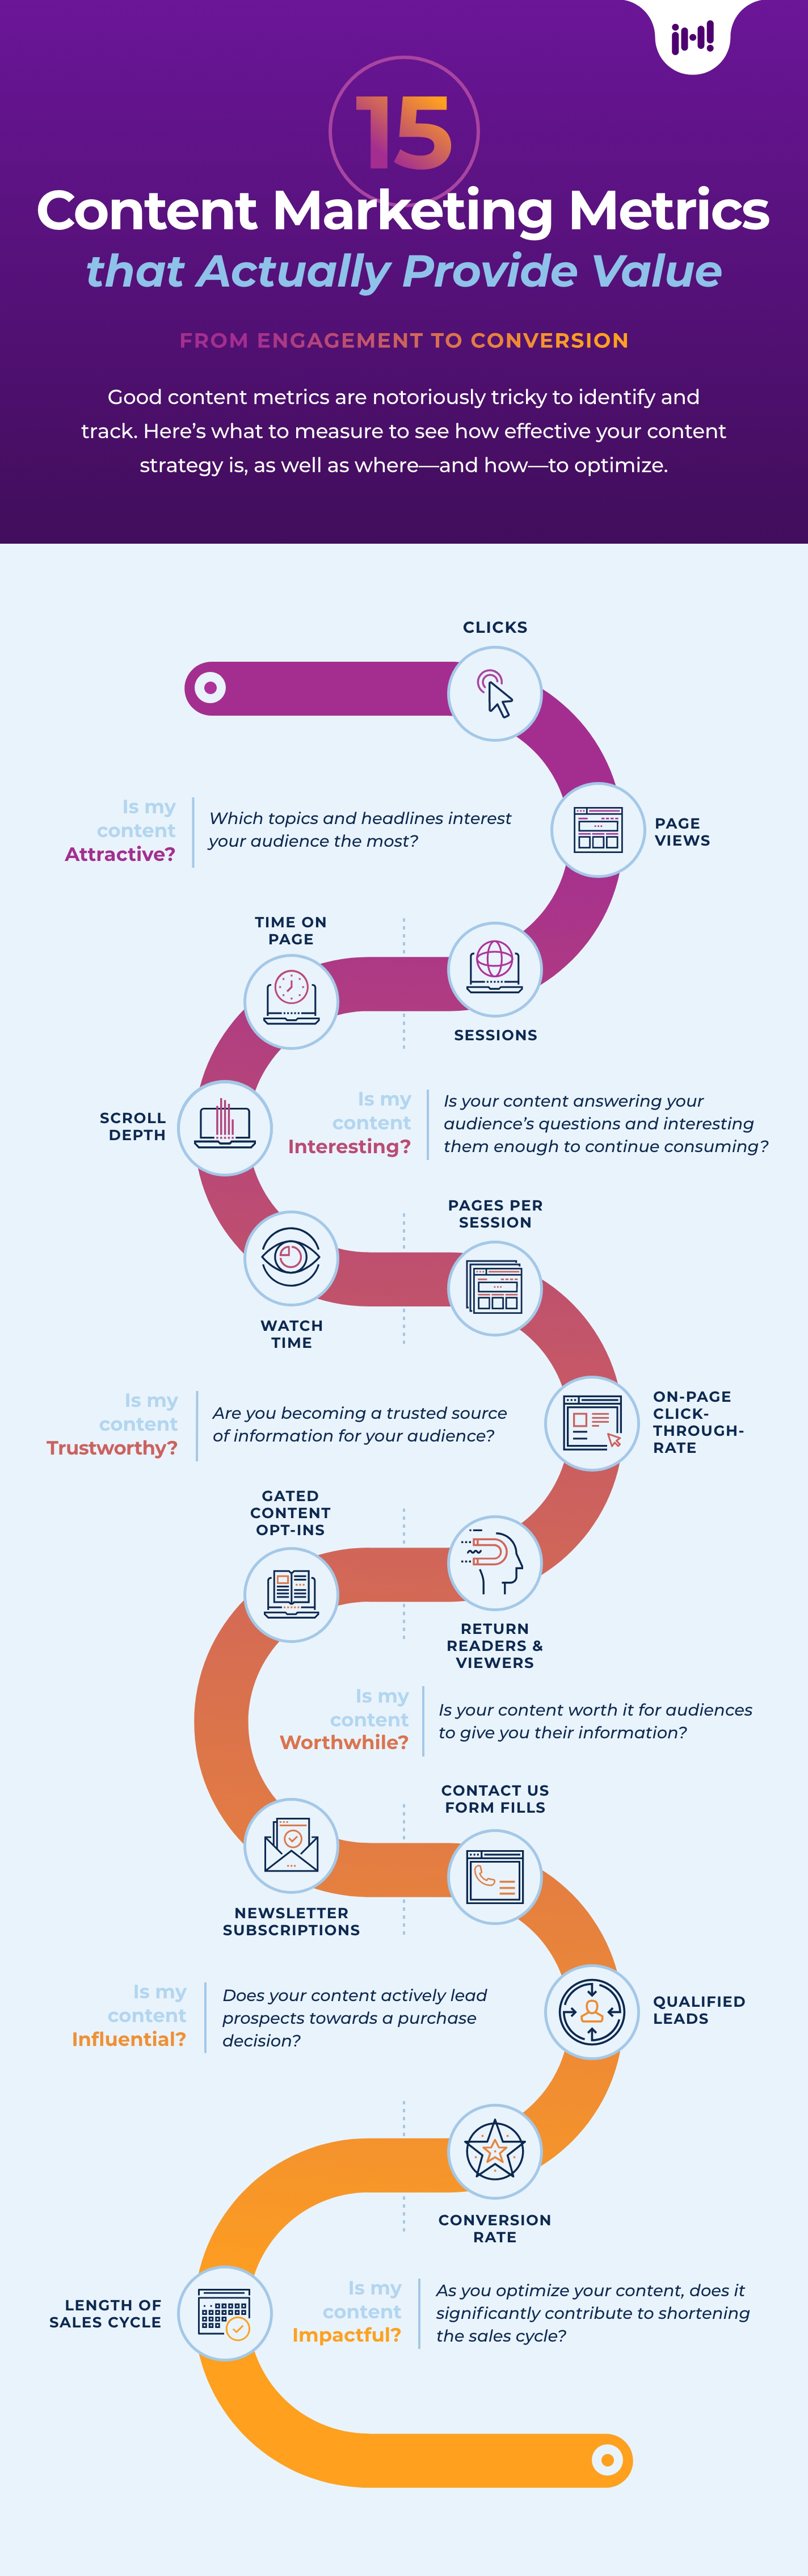
“But half of those are vanity metrics,” you say. The audience gasps.
First of all, we prefer to call them engagement metrics. And we don’t judge them. We just don’t depend on them alone. They tell a piece of the picture, but not the whole thing.
We recommend paying attention across the spectrum to get the full picture of how your content is doing, as each group of metrics gives you important information about the impact your content has at each stage of the journey.
Metrics that tell you how attractive your content is
(1) Clicks
(2) Page views
(3) Session count
Clicks, page views, and session count reveal audience interest in the topics and needs your content addresses. Clicks indicate the initial allure of content headlines and themes, suggesting what captures readers' attention. Page views and number of sessions give you similar insights post-bounce—here you’re measuring who actually wants to see your content and stays on the page long enough to register a session.
If these numbers are consistently low, your brand awareness might be low. Either that or the topics you create content around aren’t resonating with your audience. If they’re low for specific pieces of content, then you know those specific topics or headlines aren’t hitting home. Alternatively, if some content pieces are getting a lot of clicks, especially related to a single topic, then you can reverse engineer what questions or pain points your audience needs answers for.
Metrics that tell you how interesting your content is
(4) Time on page
(5) Scroll depth
(6) Watch time
Time on page, scroll depth, and watch time give you a good idea of whether your content is interesting enough to keep consuming and answering your audience’s questions. Time on page is tricky. How much of that time can you reasonably say is spent reading your content versus the time spent, I don’t know, making coffee or staring at the wall?
When combined with scroll depth or watch time, you get a clearer picture. A 30-minute long session? Must have been an interesting wall. 6 minutes? Could be coffee. A 6-minute long session where they scrolled to the bottom? They must have found that content valuable. On the flip side, if a lot of viewers are dropping off around the same point, that’s an indication of where you need to optimize.
Metrics that tell you how trustworthy your content is
(7) Pages per session
(8) On-page click-through-rate (CTR)
(9) Return readers and viewers
Pages per session, on-page click-through-rate (CTR), and return readers and viewers provide insights into whether you are successfully establishing your content platform as a go-to, trusted hub of information for your audience—critical for both human audiences and AEO. The thing to look for here is whether people are accessing your content and leaving or consuming your content and then looking for more. That’s what pages per session tells you. Beware, though—a low pages per session number doesn’t necessarily mean your audience doesn’t want more. It could mean you’re not interlinking well or your website design doesn’t encourage browsing.
On-page CTR reflects the effectiveness of calls-to-action and internal links, indicating if your audience trusts the recommendations and suggestions provided within the content. Do you have a lot of return readers and viewers? It’s a good indication that you’re doing something right—viewers are starting to see you as a consistent source of valuable information. Don’t have a lot of returns? Your content probably needs a refresher to make sure it’s delivering value.
Metrics that tell you how worthwhile your content is
(10) Gated content opt-ins
(11) Newsletter subscriptions
Gated content opt-ins and newsletter subscriptions tell you how willing your audience is to exchange their personal information for access to exclusive content. We hope marketers grasp—and respect—just how much trust that implies.
It means your content is valuable enough that it’s worth getting into a nurture or on a salesperson’s radar. There are two potential insights here. Either your content is just that great or they trust you to not abuse their contact info. Remember what Uncle Ben once said, “With great power there must also come great responsibility.”
Metrics that tell you whether your content is influencing action
(12) Contact us form fills
(13) Qualified leads
(14) Overall conversion rate
Contact us form fills, qualified leads, and the overall conversion rate work together to help you gauge how effectively your content is driving prospects towards a purchase decision. What makes these content marketing metrics different from the previous is how far apart they are from the content itself. A click or page view gives you direct insight into that particular piece of content. Here, you have to do some mapping to make the connection.
If you find that your current leads or conversions have previously consumed your content—especially if they’ve consumed a lot of it or even learned about you through your content—you can infer that your content had an influence on their journey and decision. On the other hand, if you have a lot of people engaging with your content and no leads, then you’re probably missing middle of the funnel or bottom of the funnel content.
If you have leads who have never engaged with your content previously, you could be missing out on an opportunity to accelerate the sales funnel, which brings us to the last category of content marketing metrics.
Metrics that tell you about the impact of your content marketing
(15) Sales cycle length
This is the longest game of all of them. As you optimize your strategy, improve your content, and fill out the whole journey with the right content, you should see the length of your sales cycle shorten. In addition to attracting leads, your content should ultimately help move prospects toward conversion.
It’s tricky to measure, but possible. Compare content touches for everyone on the buying team of your closed-won accounts to see if there’s a correlation between more content consumption and shorter sales cycles.
The Iron Horse insight
There is no single metric that will tell them what they want to know. It’s a mosaic of metrics or nothing. And it’s not going to be fast. You can’t write a blog and host a webinar and expect that to turn into pipeline tomorrow. Content marketing is an investment. It’s constant work and optimization cycles. But, combined with the right content strategy and the right agentic AI, it does work. And you can quote us to your boss on it.